This page provides details about Langmuir non-linear regression with CAVS. Support material and details for the Langmuir (1918) model are provided.
Reference
When using the Langmuir model to analyze your experimental data, it is important to acknowledge the original author by including a citation to their article.
THE ADSORPTION OF GASES ON PLANE SURFACES OF GLASS, MICA AND PLATINUM.
Irving Langmuir
DOI: 10.1021/ja02242a004
Journal of the American Chemical Society 1918, 40, (9), 1361-1403
Definition of the Langmuir model
The Langmuir model (1918) is a two-parameter model that is defined through the equation below:
$$ q_{eq}=\frac{q_{L}K_{L}C_{eq}}{1 + K_{L}C_{eq}} $$
where:
- $q_{eq}$ is the adsorbate concentration in the solid phase at equilibrium;
- $C_{eq}$ is the adsorbate concentration in the fluid phase at equilibrium;
- $q_{L}$ is the maximum adsorption capacity of the monolayer;
- $K_{L}$ is the model constant;
You can find ready-to-use Langmuir model formula in .docx or $\LaTeX$ files in this Github repository.
Due to the non-linear nature of the Langmuir model, the model parameters ($q_{eq}$ and $K_{L}$) must be estimated using the least squares method.
Unit of the Langmuir model parameters
Given that the concentration in the liquid phase ($C_{eq}$) has units of $mg_{adsorbate}/L$ and that the concentration in the solid phase has units of $mg_{adsorbate}/g_{adsorbent}$, the units of the parameters must be:
$$ q_{eq}=\frac{mg_{adsorbate}}{g_{adsorbent}} $$
$$ K_{L}=\frac{L}{mg_{adsorbate}} $$
Checking the units
In order to verify the units of the parameters, we can simply substitute each parameter with its corresponding unit. Therefore:
$$ q_{eq}=\frac{q_{L}K_{L}C_{eq}}{1 + K_{L}C_{eq}}\rightarrow \frac{mg_{adsorbate}}{g_{adsorbent}}=\frac{\frac{mg_{adsorbate}}{g_{adsorbent}}\frac{L}{mg_{adsorbate}}\frac{mg_{adsorbate}}{L}}{1 + \frac{L}{mg_{adsorbate}}\frac{mg_{adsorbate}}{L}} $$
Proceed by simplifying the equation, eliminating the units where necessary:
$$
\frac{mg_{adsorbate}}{g_{adsorbent}}=\frac{\frac{mg_{adsorbate}}{g_{adsorbent}}\frac{\color{red}{\cancel{L}}}{mg_{adsorbate}}\frac{mg_{adsorbate}}{\color{red}{\cancel{L}}}}{1 + \frac{\color{blue}{\bcancel{L}}}{mg_{adsorbate}}\frac{mg_{adsorbate}}{\color{blue}{\bcancel{L}}}}
$$
$$
\frac{mg_{adsorbate}}{g_{adsorbent}}=\frac{\frac{mg_{adsorbate}}{g_{adsorbent}}\frac{\color{red}{\cancel{mg_{adsorbate}}}}{\color{red}{\cancel{mg_{adsorbate}}}}}{1 + \frac{\color{blue}{\bcancel{mg_{adsorbate}}}}{\color{blue}{\bcancel{mg_{adsorbate}}}}}
$$
$$
\frac{\color{red}{\cancel{mg_{adsorbate}}}}{\color{blue}{\bcancel{g_{adsorbent}}}}=\frac{\frac{mg_{adsorbate}}{g_{adsorbent}}}{1}=\frac{\color{red}{\cancel{mg_{adsorbate}}}}{\color{blue}{\bcancel{g_{adsorbent}}}}
$$
$$ 1=1 $$
Step by Step tutorial on how to perform Langmuir non-linear regression with CAVS (only five steps)
You can download the spreadsheet with the data used in this example by clicking here (Google Drive). The .zip file contains several spreadsheets with adsorption data used for examples. The spreadsheet used is 11 – Equilibrium modeling.xlsx.
Step 1) Prepare the spreadsheet
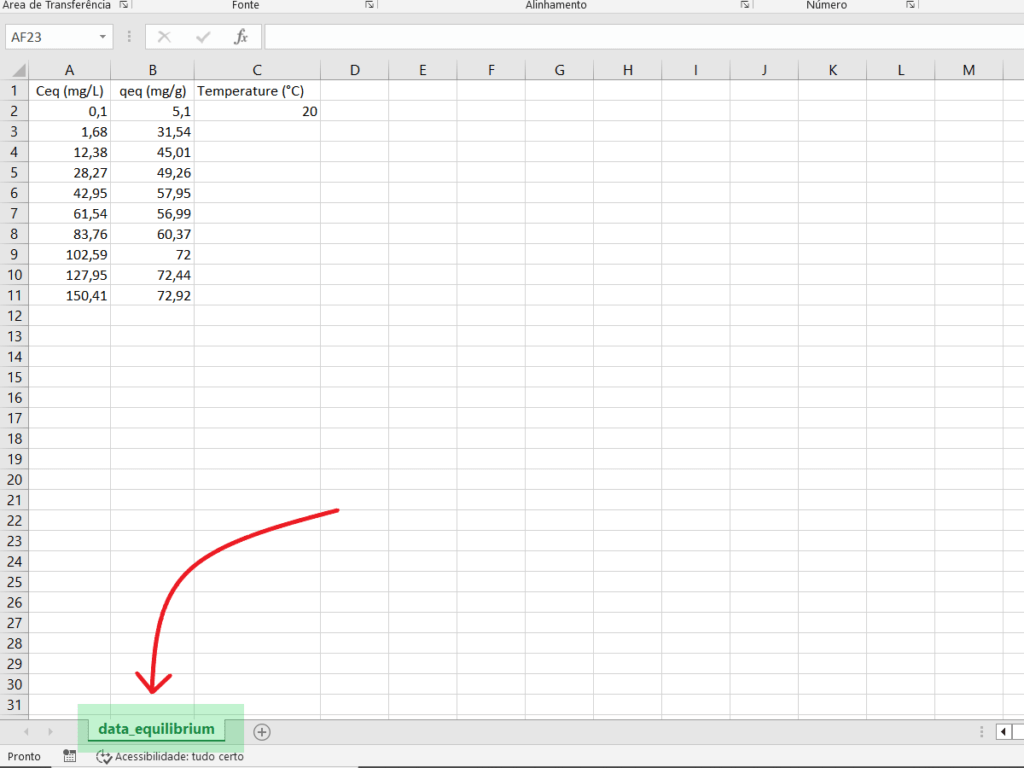
The first step is to prepare the worksheet with the adsorption equilibrium data. Data entry must be done through .xlsx files. The data must be stored in a tab called “data_equilibrium”, which must contain the data in the following order:
- Column A: Equilibrium concentration data in the liquid phase ($C_{eq}$), starting in the second row. Cell A1 must contain some text.
- Column B: the equilibrium concentration data in the solid phase ($q_{eq}$), starting in the second row. Cell B1 must contain some text.
- Column C: the temperature (degrees Celsius) used to obtain the Isotherm must be stored in cell C2. Cell C1 must contain a text.
Columns A, B and C should be reserved for the experimental data only. The remaining columns can contain other data. The Figure below shows how the data should be arranged.
Although not mandatory, it is recommended that the data in column A (equilibrium concentration in the fluid phase) be sorted in ascending order.
The .xlsx file must be closed before being loaded into CAVS - Adsorption Evaluation
Step 2) Choose options for regression and evaluation of results
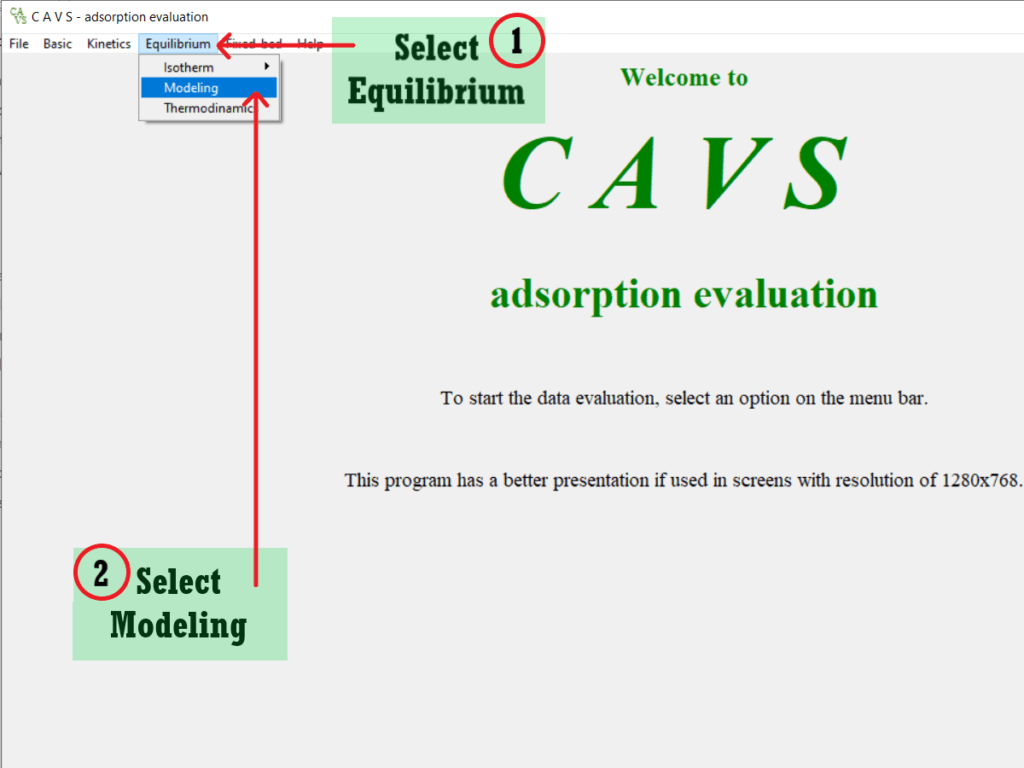
The second step is to decide which parameters are used to perform the regression and evaluate the results. First, open the CAVS – Adsorption Evaluation (if you haven’t installed it yet, see this tutorial that shows the steps to be followed). Then go to the “Equilibrium” menu and click on “Modeling”.
Select the Langmuir model
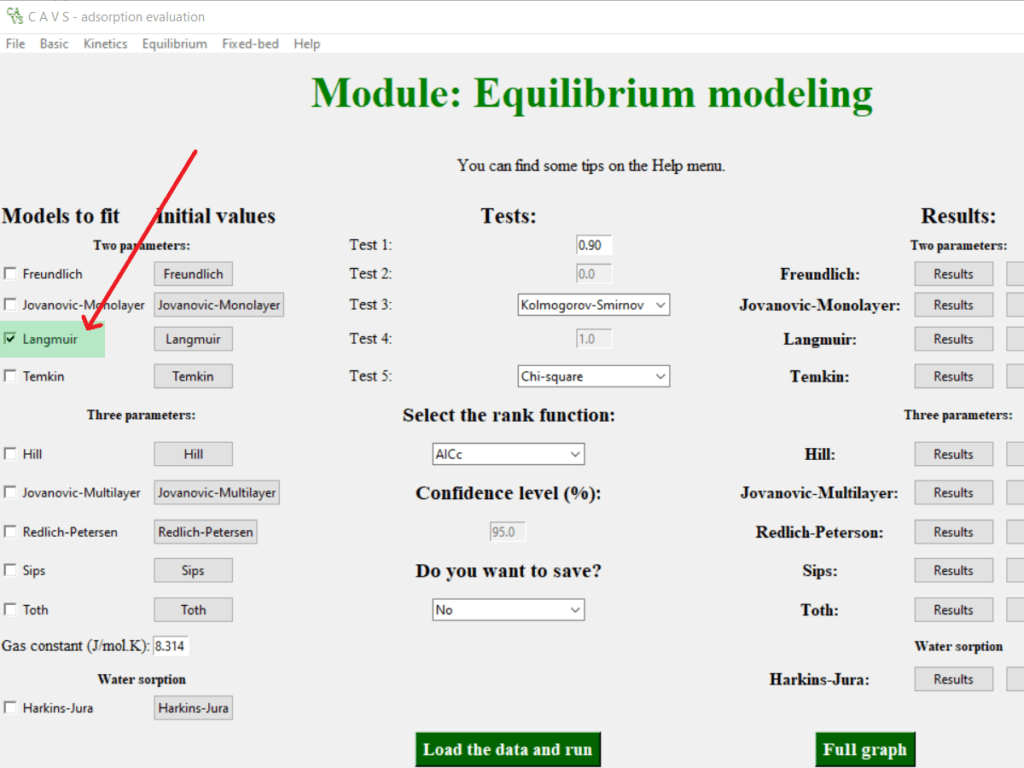
To fit the Langmuir model to the experimental data, select the Langmuir box in the center left corner.
Choose options for data analysis
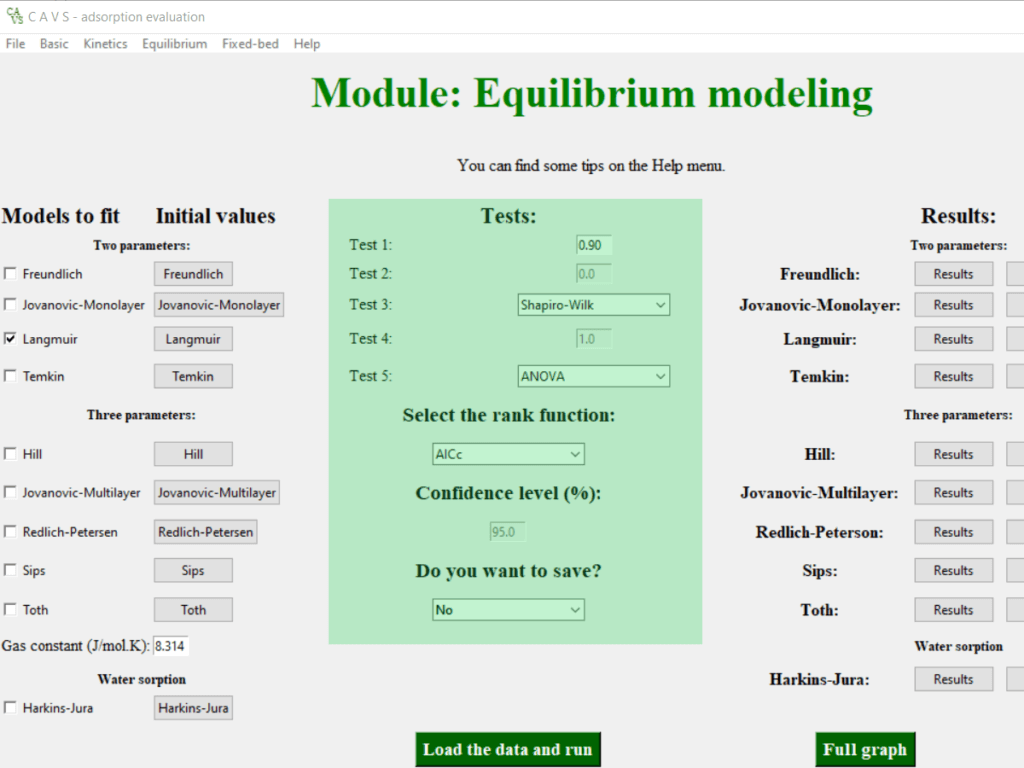
In the central column you can choose some options about the tests that are applied in the regression.
Test 1: correlation test between predicted and experimental values
This test checks whether the correlation between predicted and experimental values is strong ($r_{pearson}$). You can change the critical value if you like, but we recommend keeping it at $0.90$ (default). If $r_{pearson}>0.90$ the test returns “YES”. Otherwise, it returns “NO”.
Test 2: residual mean test
This test checks whether the residuals have a mean equal to zero (one sample t test). It is not possible to change the comparison value ($\mu_{0}=0$). If $\overline{residuals}=0$ the test returns “YES”. Otherwise, it returns “NO”.
Test 3: Residual Normality test
This test checks whether the residuals are normally distributed. By default, the Kolmogorov-Smirnov test is used. We strongly recommend switching to the Shapiro-Wilk test. If the residuals are considered with Normal distribution, the test returns “YES”. Otherwise, it returns “NO”.
Test 4: standard deviation test
This test checks whether the standard deviation of each parameter is greater than its absolute value. If the standard deviation is less than the absolute value of the respective parameter, the test returns “YES”. Otherwise, it returns “NO”. You cannot change the threshold to determine whether the standard deviation is greater than its absolute value (default is 1).
Test 5: regression significance test
This test checks whether the regression was significant. By default the Chi-square test is applied. We recommend switching to the ANOVA test. If the regression is significant, the test returns “YES”. Otherwise, it returns “NO”.
Ranking function
Choose which ranking function will be calculated.
Level of confidence
Determines which confidence level is adopted. It is not possible to change the value of $95\%$ ($\alpha=0.05$).
Save the results
To save the results, change the option from “No” (default) to “Yes”. The results are saved in the data entry worksheet.
It is advisable to only save the results once it has been confirmed that the fit was performed correctly.
Step 3: Perform the regression
After making your choices, we must actually perform the regression.
Load the data
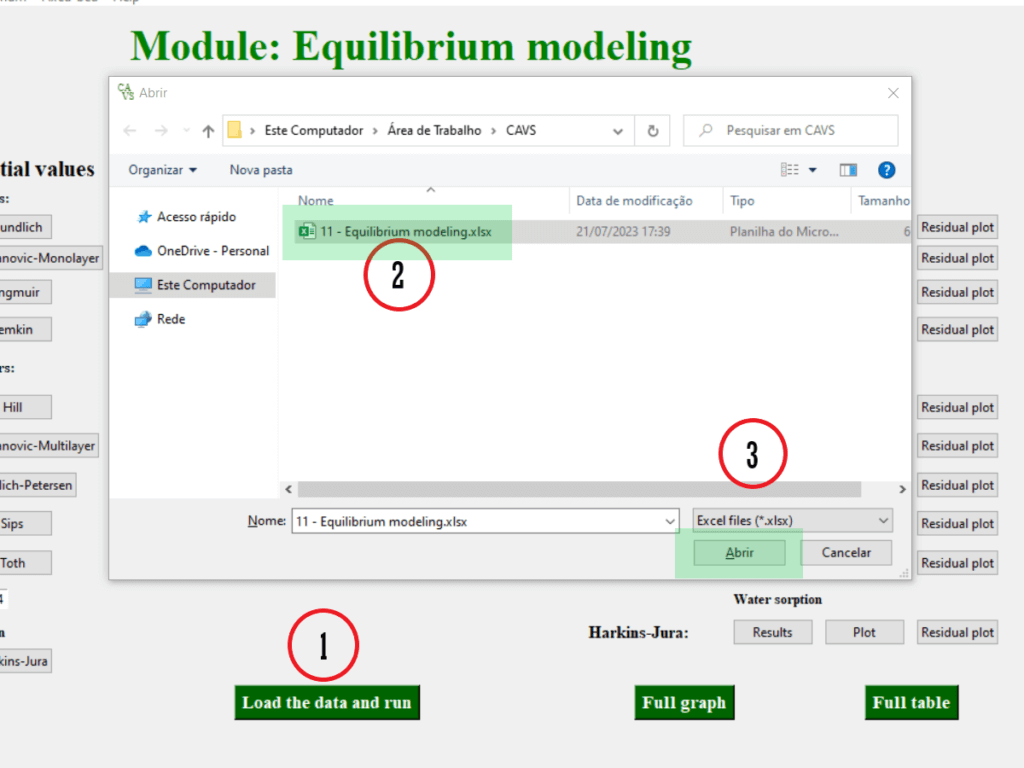
To load the data and perform the non-linear regression,, click on the “Load the data and run” button on the bottom center of the screen. In the window that will open, navigate to the place where the spreadsheet prepared in Step 1 is located. Select the sheet and click “Open”.
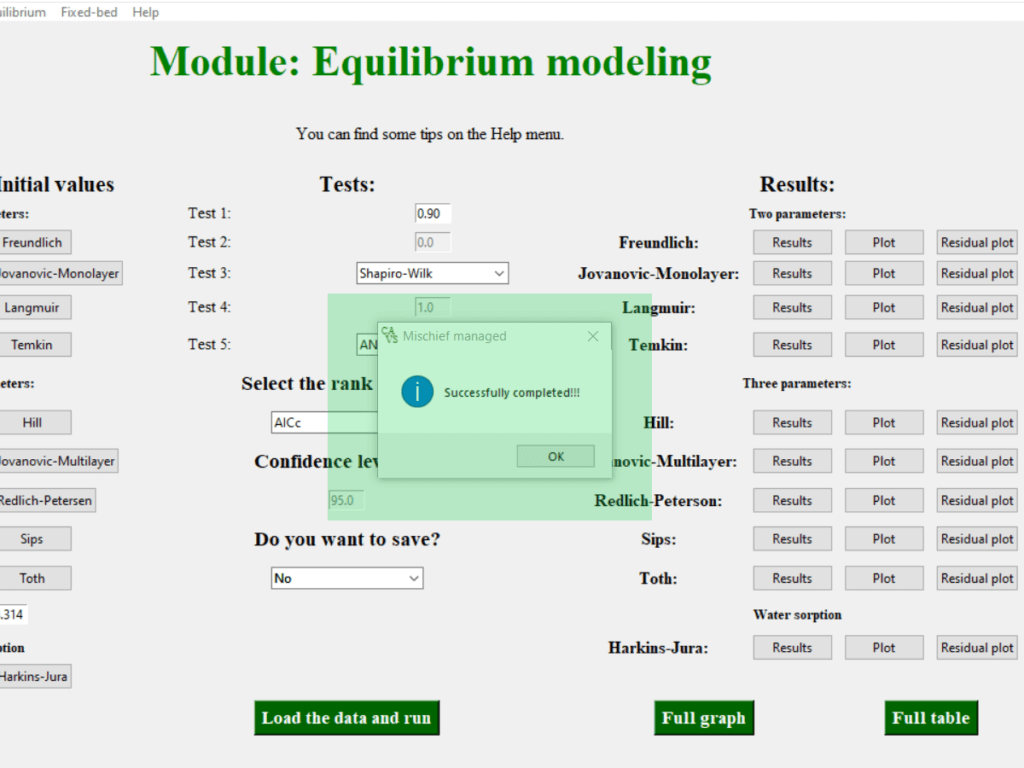
A warning will be issued informing you if the regression was successful. A warning will also be issued if something unexpectedly went wrong during the regression.
Step 4: Check the main results
After the regression is finished, it is important to evaluate the results in general.. In the right column you can check the main results, which are the test results, the regression graph and the residual graph.
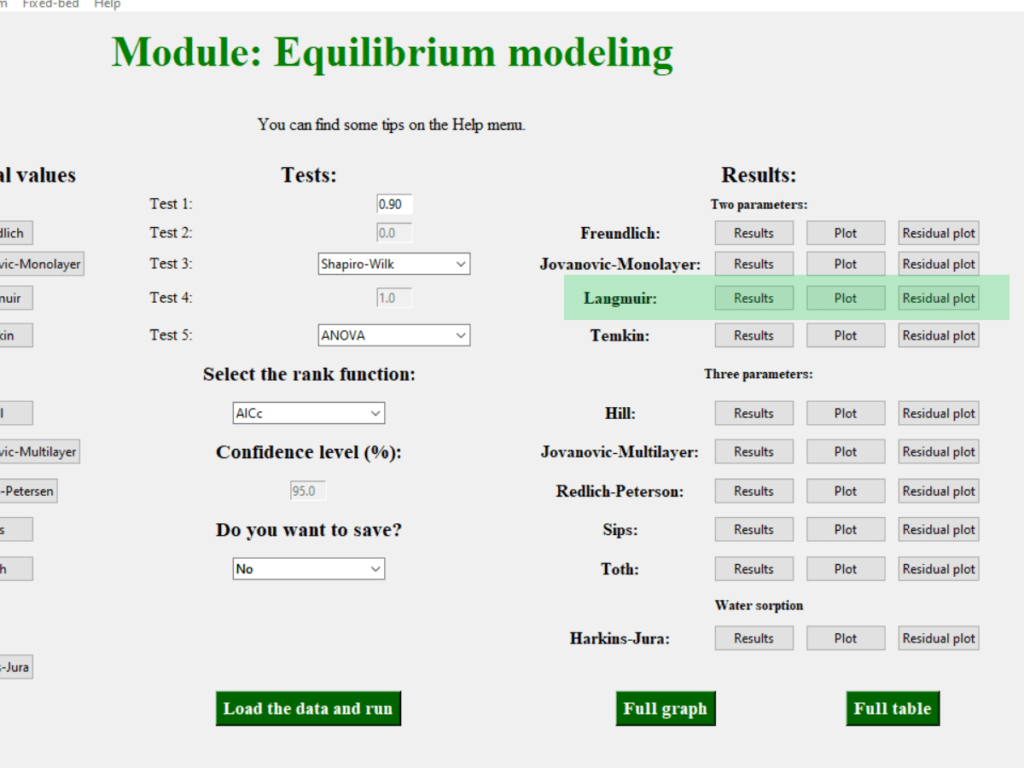
By clicking on the “Results” button, a tab with the summary of the 5 applied tests will open.
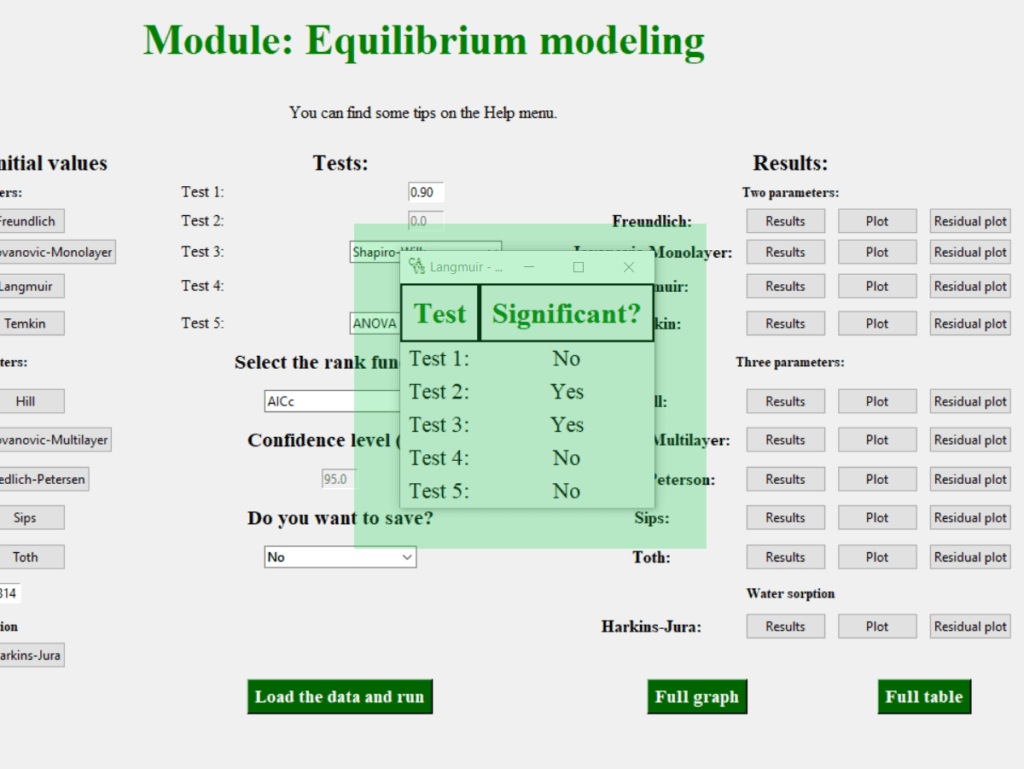
Of the five tests applied, the model fails in 3. Ideally, it should not fail in any tests. This is a strong indication that, although the convergence criteria were met, the parameters were not adequately estimated. This can be confirmed by viewing the regression graph by clicking on the “Plot” button.
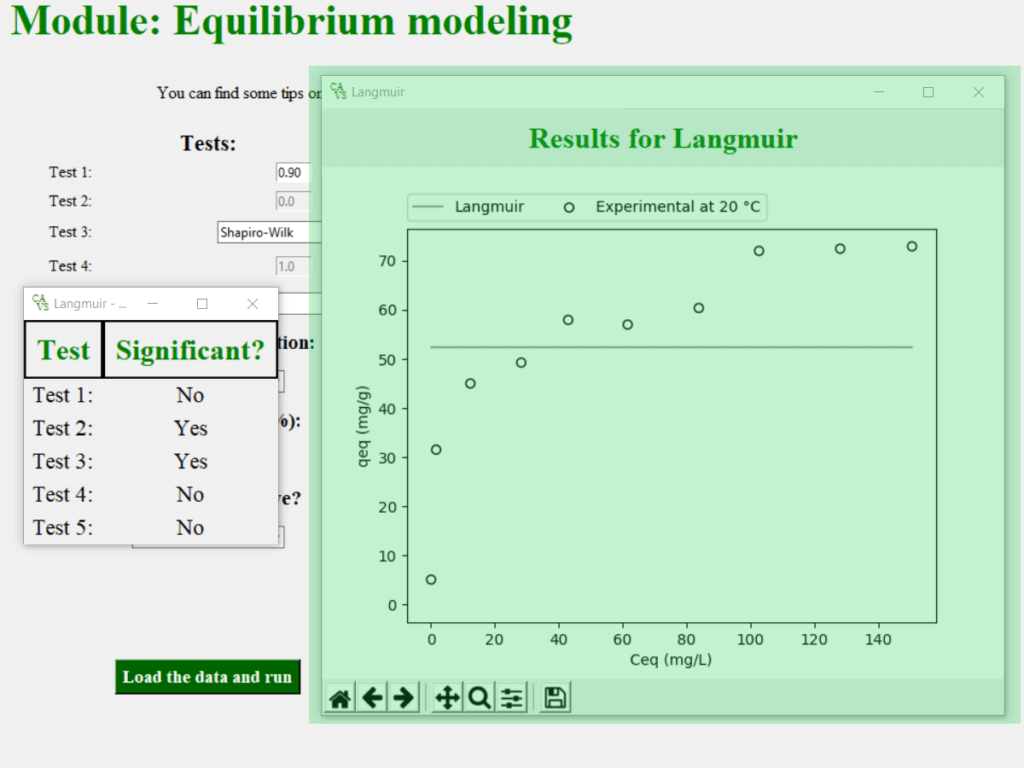
As you can see, the fit was performed but resulted in a line parallel to the x axis. When this happens, it is necessary to redo the fitting, but adopting another initial guess for the parameters of the Langmuir model (returning to Step 2).
Changing the initial guess of the Langmuir model parameters
Click the Langmuir button in the center left corner to change the initial value of the Langmuir model parameters. A window will open with two boxes where you can change the value of each parameter.
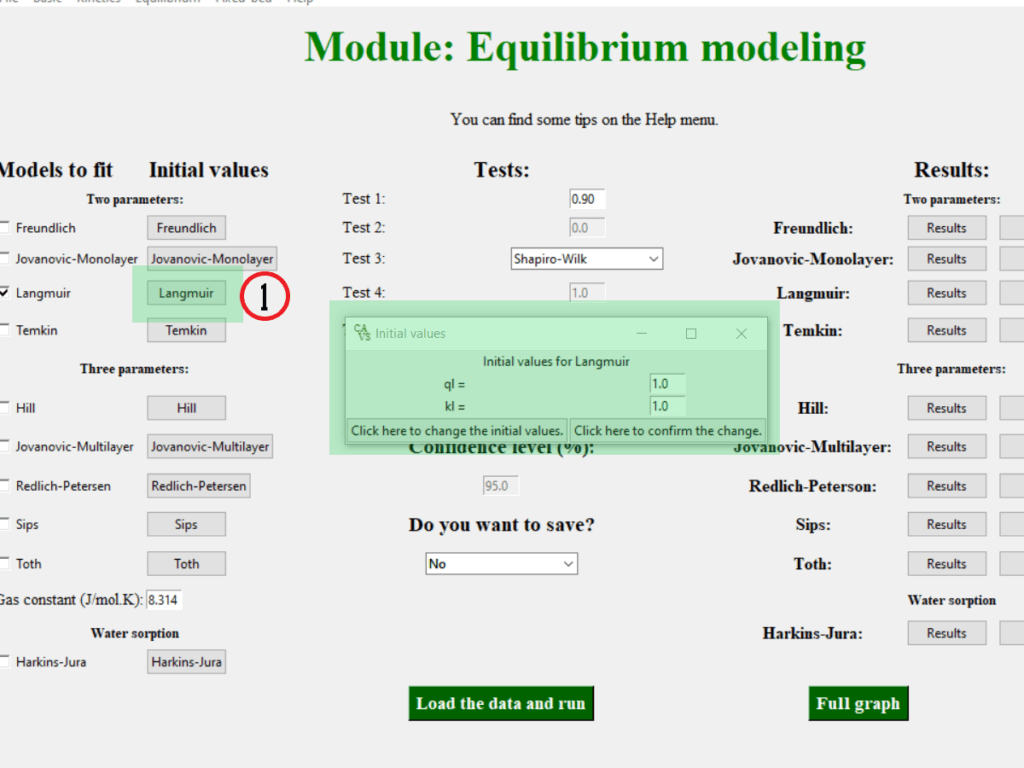
The critical parameter of the Langmuir model is the $K_{L}$ parameter. If the fit does not converge with the default values, we recommend reducing the initial guess of the $K_{L}$ parameter by 10 until a solution is found. If the problem persists, try increasing the value of $K_{L}$ by 10. If you still have problems, change the initial guess of the parameter $q_{L}$ to a value close to that obtained experimentally.
For this dataset it is necessary to change the parameter $K_{L}$ to $0.001$. To make the change, click on the left button (button 1). To confirm the change, click on the right button (button 2). It is necessary to click on both buttons for the change to take place.
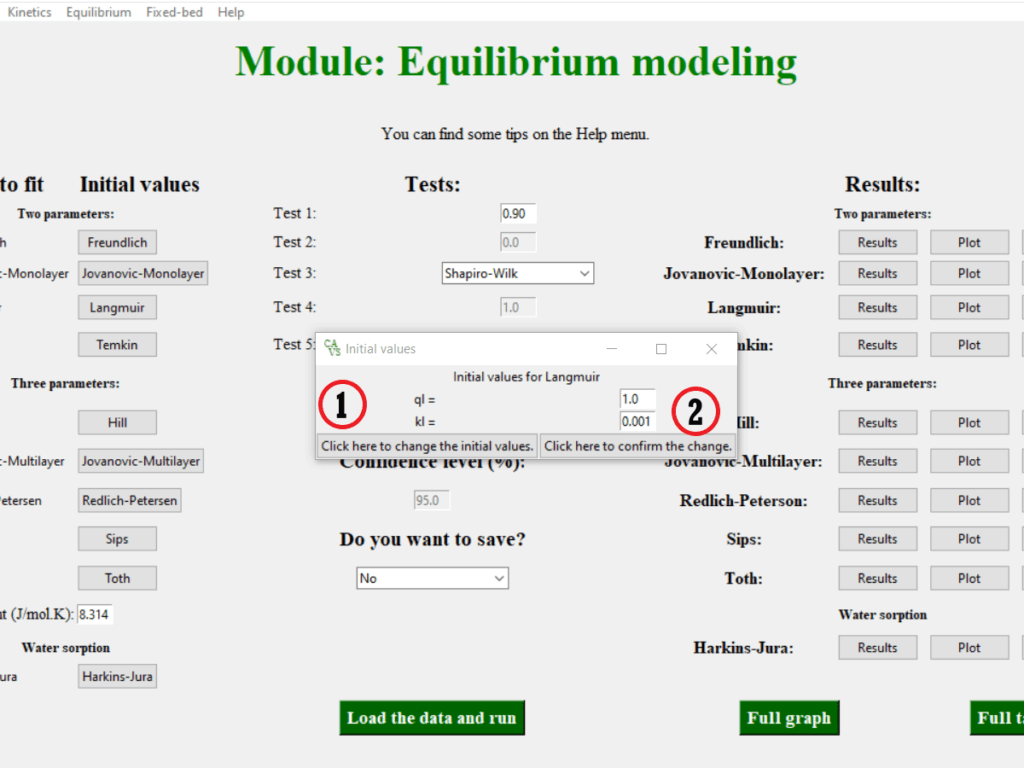
Although rare, there is a possibility that no combination of values for the initial guess will cause the regression to proceed properly.
Redoing the fit
After changing the initial values, make the fit again (Step 3)
Check again the main results
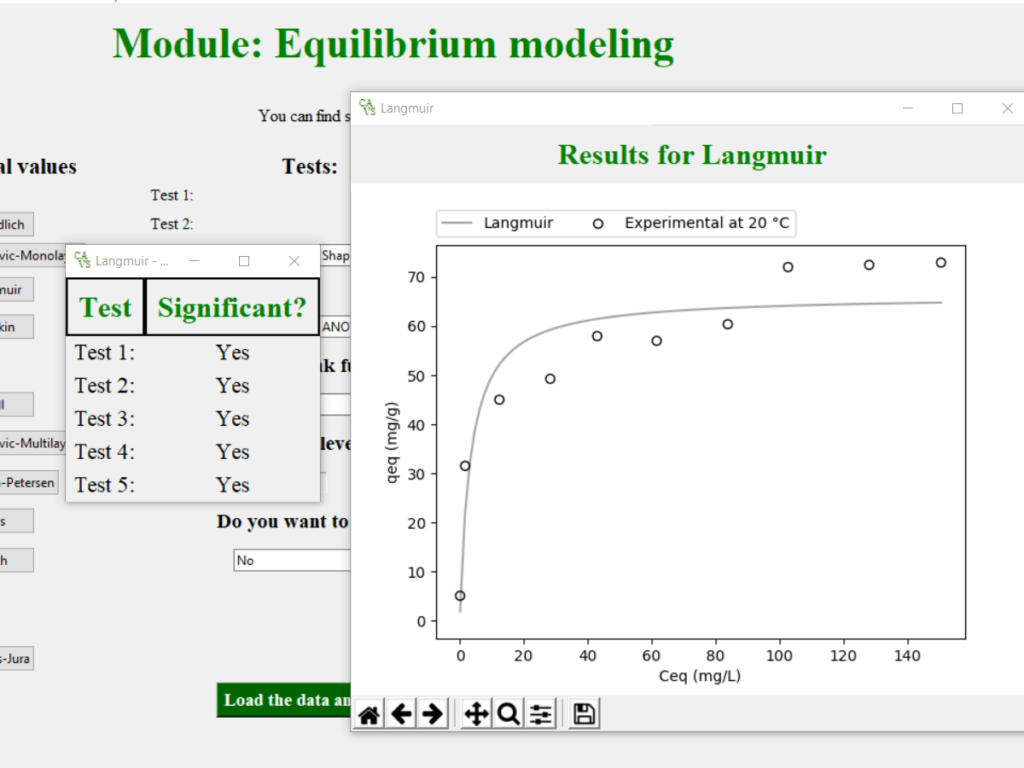
Click the “Results” and “Plot” buttons for the Langmuir model. If an exponential curve is present, then the fit is correct. The model passing all five tests corroborates this statement.
Step 5: save the results
Now that the regression is being performed correctly, we need to export the results to store the analysis in a suitable place.
To export the results, change the option from “No” to “Yes” in the box “Do you want to save?” This will cause the numerical results to be saved in the data entry worksheet.
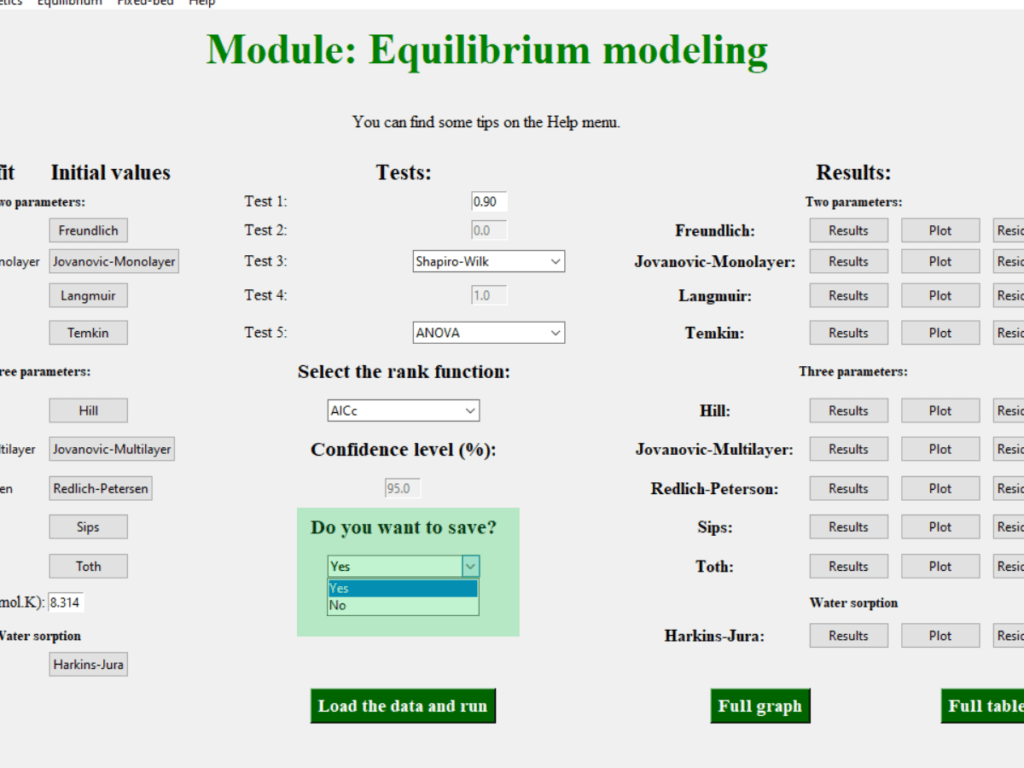
After changing the option, perform the regression again so that the results are saved in the .xlsx file.
The provided .xlsx file must be closed in order to be able to save the results in the worksheet
Check the results!
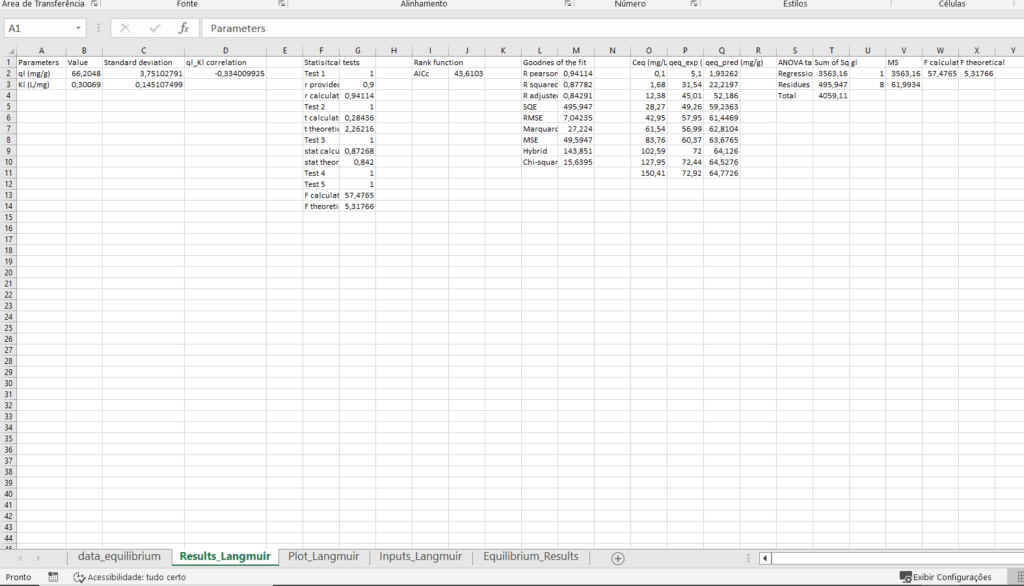
Once the data has been exported, we can check the details in the excel file. After the message confirming the completion of calculations, open the worksheet. Four new tabs will be created:
- The “Results_Langmuir” tab contains the results of the regression estimates, the critical values and statistics of the applied tests, goodness-of-fit metrics, and experimental and predicted values.
- The “Plot_Langmuir” tab contains the numerical values used to plot the graphs. You can use this data to draw the graph in the most suitable graphic editing software.
- The “Langmuir Inputs” tab contains the data used as input to perform the regression.
- The “Equilibrium_Results” tab contains the test results as well as the result of the models ranking function (only useful for comparing models).
Video Tutorial - How to fit the Langmuir model in 5 steps
While the above step can be helpful, videos alone can be more instructive and simpler to follow. In the video below you will find the step by step described above in the tutorial format.
If you prefer, copy and paste the following link into your browser.
Conclusion
In this article we saw some details about the Langmuir model and also how to do the non-linear regression using the software CAVS – Adsorption Evaluation. If you have any questions, comments or suggestions, write them down below or if you prefer, contact us at andersonmdcanteli@gmail.com.
